Dispatch 19 – It’s the Law, the Power Law, but why?

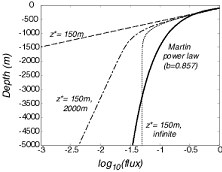
The intuitively appealing first-order kinetics and constant sinking rate predict a much greater decrease in the flux with depth than does the observationally justified power law.
The flux of sinking particles, i.e. the mass sinking through a square meter each day, decreases as you go deeper into the sea, and in many regions this decrease is well described by a Power Law:
Flux(z) = Flux(zo) (z-zo)-b
This expression states that the flux at depth z depends on the initial flux at depth zo (typically taken as the base of the sunlit near surface layer or euphotic zone) and drops off with depth. The power law coefficient “b” is typically close to 1 (the observed range is between about 0.5 and 2), so that flux falls off approximately with the reciprocal of depth – so for example the flux at 2000 meters below zo will b only ~half that at 1000 meters. This expression is often referred to as the Martin curve after one of its early proponents (Martin et al., 1987) All well and good, but WHY?
The power law is not the simplest relation that we might expect. Instead, many physical, chemical, and biological processes follow “first-order” kinetics, which state that the amount of progress of a process is just proportional to the amount of material being processed. A familiar example would be water running out of most bathtubs – it starts off quickly, and slows down as the amount remaining decreases. This behaviour is described by an Exponential Law:
Flux(t) = Flux(to) e(t-to)/t*
In this expression t* is the time-scale that describes the system. If the particles are sinking at a constant rate, s=z/t, we can reformulate this in terms of depth as
Flux(z) = Flux(zo) e(z-zo)/z*
How does this expression compare with the Power Law? As shown in the figure above, the intuitively appealing first-order kinetics and constant sinking rate predict a much greater decrease in the flux with depth than does the observationally justified power law.
This has lead to suggestions that the flux may be made up a combination of fast reacting components (e.g. materials with length scale for reaction of ~150m to match the top of the Martin curve), and slow reacting components (with longer length scales of 1000’s of meters, or even an infinite length scale for a non-reactive component) to match the lower part of the Martin curve.
There are many other ways that the chemically appealing Exponential Law could be made to fit the observations – for example the sinking rates of particles might increase with depth, altering our time-depth transformation as presented above.
Berelson (2001) suggested that this does occur, based on sinking rates evaluating by comparing deep trap records of the time of arrival of seasonal “pulses” of material. (Other possibilities include other things which might decrease with depth, for example respiration rates in response to pressure limitation, encounter frequencies with consuming organisms, etc.).
During VERTIGO we are attempting to measure in-situ sinking rates using a glorified settling column, also known as an IRS trap (conceived by John Hedges and others at the University of Washington and now available commercially from Prime Focus, Inc.). Sinking particles fall onto an Indented Rotating Sphere. Every 6 hours this dumps the particles into a second column where they settle into 11 different tubes which are successively rotated beneath the tube. The first tube is rotated into place for just one minute, and particles must sink faster than 800 meters/day to reach it. The last tube collects particles sinking at ~2 meters per day.
These measurements will eventually contribute to understanding the origin of the power law, thereby providing a framework to connect biogeochemical studies of degradation processes (which display exponential laws) with the flux variations with depth in the ocean. The sinking rates will also help us evaluate the source regions of our collected particles, by providing an indication of when the particles left the surface layer.
— Tom Trull
- The in-situ settling column, a.k.a. the IRS trap. The grooved sphere catches the particles and dumps them into the column of seawater, through which they fall to reach the tubes which are sequentially rotated into place.


