Dispatch 18 – Determining Sinking Particle Collection Funnels
Objective analysis of satellite altimeter determined sea level centered on June 29, 2004. High sea level represents high pressure and the arrows are the associated geostrophic currents. The crossing point of the dotted lines is the HOT time series station site which is the center point of VERTIGO project’s sampling. Near real time satellite observations have been provided from Bob Leben of the University of Colorado.
The sinking flux of particles in the ocean has many similarities and many important differences compared with the raining of raindrops in atmosphere. Both raindrops and sinking particles undergo transformations (combining to make larger particles, disaggregating into smaller, etc.) as they fall. Again, many of the processes creating these transformations are the same and some are different. Most notably, the ocean flux of particles is transformed by biological processes, such as zooplankton feeding and excretion, which are obviously not found in the atmosphere.
Another way that the sinking rain of marine particles differs from rain of raindrops is their gravitational settling rates. Sinking particles sink collected in our sediment traps fall at incredibly slow rates; 10 to a couple 100 meters per day. This means that particles sinking from the upper ocean into the twilight zone will take a few days to a couple months to make this journey. However, these particles will not make this journey sinking straight downward. This is where an understanding of physical oceanography becomes important.
Simply stated, sinking particles sink horizontally. The horizontal currents in the sea are much greater in magnitude than the gravitational sinking speeds of marine particles. Differences are factors of more than 100!!! This means the sedimenting particles do not fall vertically but “sink” nearly horizontally pushed by ocean currents. This means that a trap collection may have little relationship to the biological processes occurring above the trap.
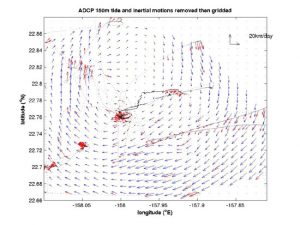
Analyzed mean velocity vectors at 150 m depth from the R/V Kilo Moana’s Acoustic Doppler Current Profiler (ADCP) system for the first week of the VERTIGO sampling. This region represents the most intensive sampling done in VERTIGO. Note that 0.05 degrees of latitude is about 5 km of distance. The red arrows are direct measurements and the blue vectors are analyzed fields. The effects of tides and other high frequency motions are subtracted from raw observations of horizontal current to make this plot. Thanx go to Jules Hammun, Univeristy of Hawaii) for developing the real-time processing of the ADCP data from the R/V Kilo Moana.
This connection between trap collections and surface ocean properties is the goal of the research conducted by Dave Siegel and Erik Fields from the University of California, Santa Barbara. To do this, we need to measure and understand ocean currents for the region, how they change over time and integrate this understanding with how the traps capture sinking particles. We are sampling ocean currents using 1) the R/V Kilo Moana’s Acoustic Doppler Current Profiler (ADCP), 2) water-following surface drifters and 3) satellite altimetric determinations of sea level over 100 km scales. The ADCP provides real-time velocity profiles from the surface to more than 800 m depth (obviously at the ship’s location) while the surface drifters report their positions over time through the ARGOS satellite network which enable currents to be diagnosed away from the ship. Last, the satellite altimeter data are used to diagnose large-scale (100 to 1000 km) surface ocean currents and their changes over time just like a meteorologist uses air pressure maps to predict where storms will go. An example of the analyzed mean current distribution at 150 m depth from the ADCP sampling is given below. These data are used to assess the small scale (5 to 100 km) where particles have come and where the various sediment traps have gone during their deployment. This data shows VERTIGO sampling to be within a clockwise spinning vortex that is roughly 25 km across. Maps of the velocity are also made at different depth horizons from the surface layer to 500 m.
Satellite altimetry observations are used to diagnose large-scale (100 to 1000 km) surface ocean currents and their changes over time. These maps provide an excellent large-scale context for evolution of the ocean physical properties over time. These data are used like a meteorologist uses air pressure maps to predict the wind field.
Our goal again is to assess where collected particles have come from. We will combine these (and other) data to make first order assessments of the region from which sinking particles have come. In essence, we will determine the collection funnels from which sediment traps sample particles. Preliminary calculations suggest that these funnels are often many 10’s to 100’s of km distant from the trap collection locations. This work will help us make the link between biological processes in the upper ocean and the collected sinking flux.
— Dave Siegel
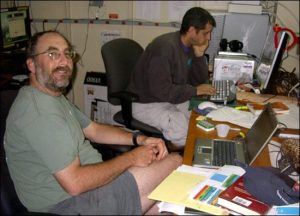
Dave Siegel (forward) and Erik Fields in their “computer cave” on the R/V Kilo Moana. (Photo by Ken Buesseler)